Home Orange Blue Green Pink
3D visualisation tools
 The OpenGL Utility Toolkit (GLUT) dll,
 This file can also be found here
The LibQGLViewer dll,
This file can also be found here
The QT 2.3 dll,
This file came with the installation of the free non commercial QT 2.3 software,
An installer for this software. (not necessary to run the demos)
Also found here.
This file can also be found here
The LibQGLViewer dll,
This file can also be found here
The QT 2.3 dll,
This file came with the installation of the free non commercial QT 2.3 software,
An installer for this software. (not necessary to run the demos)
Also found here.
 this zip, which contains all the necessary DLLs to run the demos.
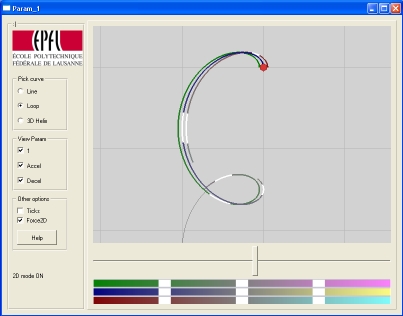 |
This demo illustrates curve parameterisation concepts. A slider controls the parameter value. The variation of this parameter draws a curve in 2D or 3D space. Several curves and different parameterisations of the same curves are available to visualise. Hit 'H' for more information on controls.
Here. |
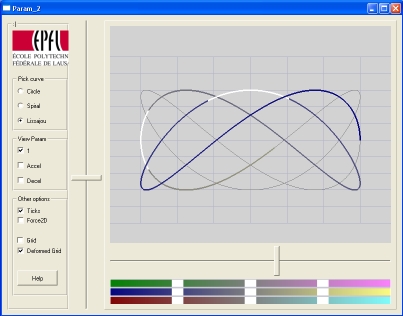 |
This demo illustrates curve parameterisation concepts too. A slider controls the parameter value. The variation of this parameter draws a curve in 2D space. Several curves and different parameterisations of the same curves are available to visualise. A second slider controls the scaling applied to one of the parameterisation components, showing how acting on the parameterisation affects the curve. Hit 'H' for more information on controls.
Here. |
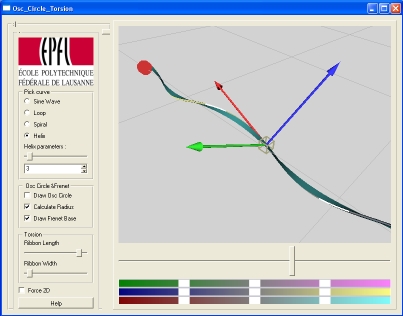 |
This demo illustrates curve tageant vectors, normal vectors, osculating circle, Frenet base and torsion. Pick a parameterised curve in 2D or 3D and a parameter value (bottom slider). Experiment with a tangeant circle (left slider) to find what radius seems to fit the best. Verify that the circle that best fits the curve is the osculating circle. Visualise the Frenet base (Tangeant vector, normal vector pointing to the osculating circle center, and third vector). Visualise the torsion (twisting "ribbon" fit to curve). Hit 'H' for more information on controls.
Here. |
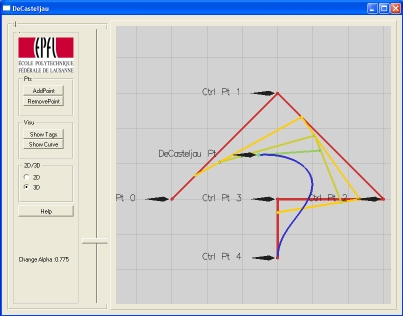 |
This demo illustrates the building and parameterisation of a Bezier curve. Add control points, select control points, manipulate them in 2D or 3D. Pick a parameter value and visualise the Bezier curve point corresponding to this value found by the DeCasteljau algorithm. Hit 'H' for more information on controls.
Here. |
